.avif)


Pattison Media manages a network of 50 radio stations across Western Canada, contributing to the group's broad reach and influence in the media and entertainment sector.
This media group had 2 outlets consumers can listen through: Traditional broadcast media and smart speakers like Amazon Alexa/Google Smart. They wanted to be able to understand the time of day in which devices people listened to their network on.
Pattison Media is a subsidiary of The Jim Pattison Group (JPG), a globally diversified holding company established in 1961 by its founder, Jim Pattison. Operating in over 100 countries, JPG boasts an extensive business portfolio.
The main goal was to determine users' device preferences at various times of the day by simplifying the survey process and collecting hour-by-hour data.
As Pattison Media has several thousands of listeners, they wanted to better understand two main behaviors
Pattison Media's theory was if consumers are listening to their platform in the middle of the day, they are likely using a smart device. If listening in the morning, it is on traditional broadcast media. But they wanted to confirm this hypothesis.
So they decided to ask their audience through a survey, but they needed a tool with advanced logic to power the type of in-depth survey questions needed to get the insight they were looking for.
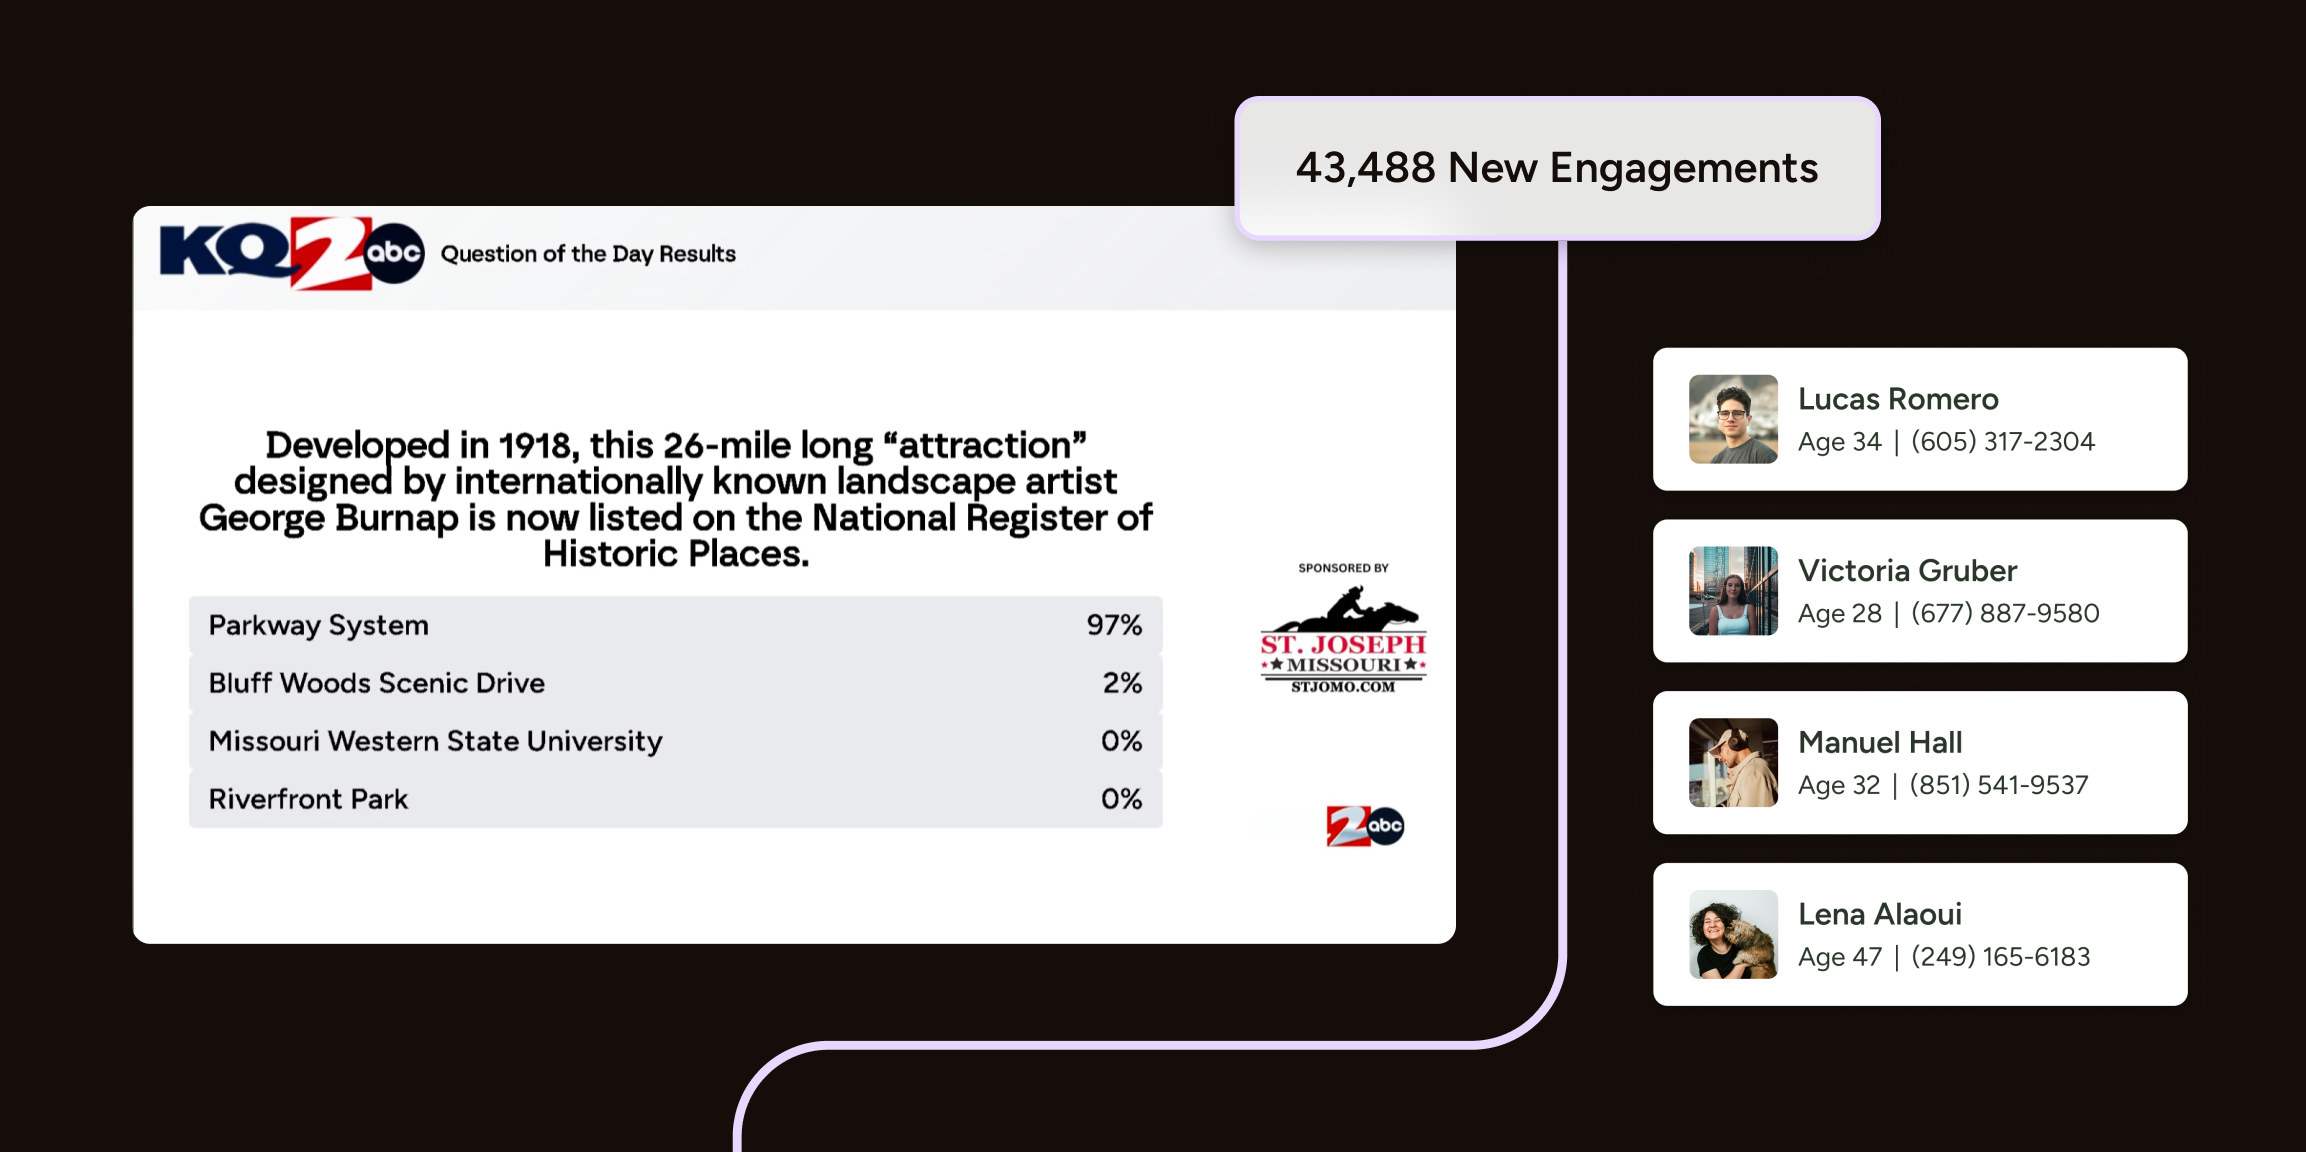
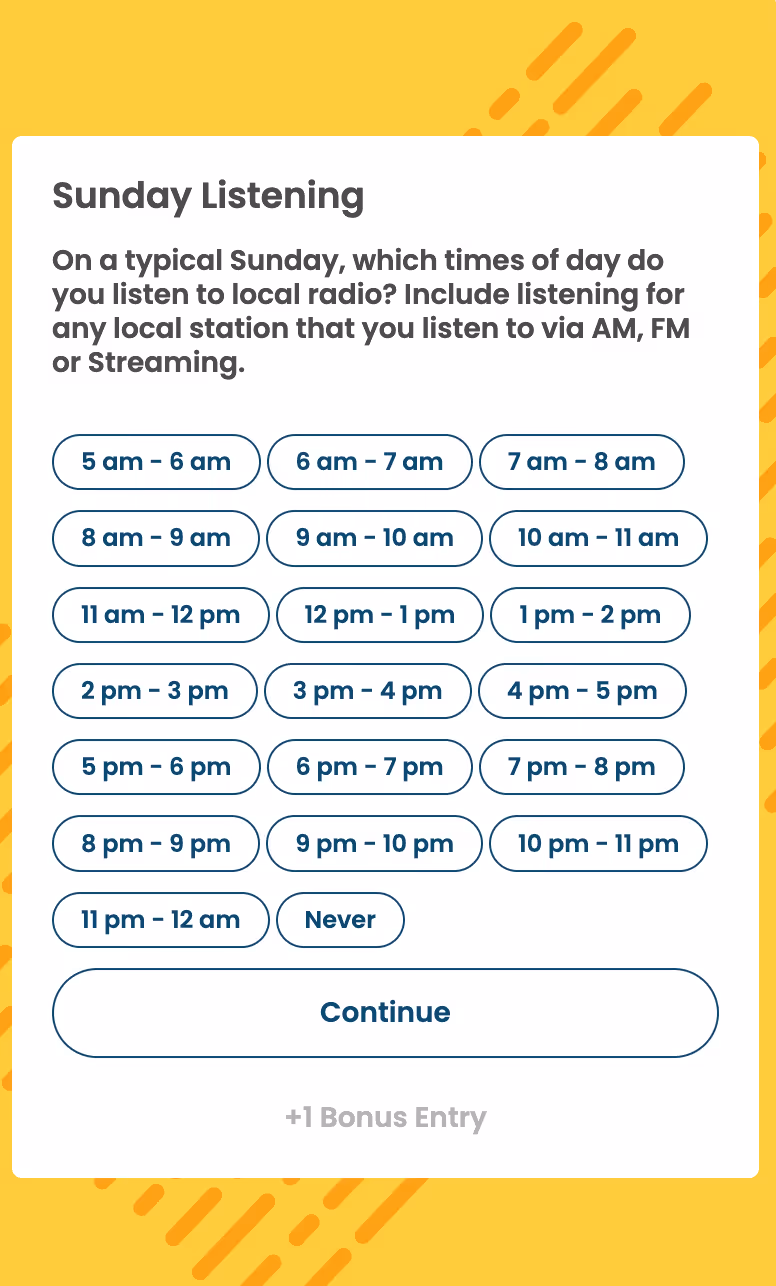
The enticing incentive given away was the chance to win $5,000 worth of cash in exchange for their audience telling them how they listen to local radio.
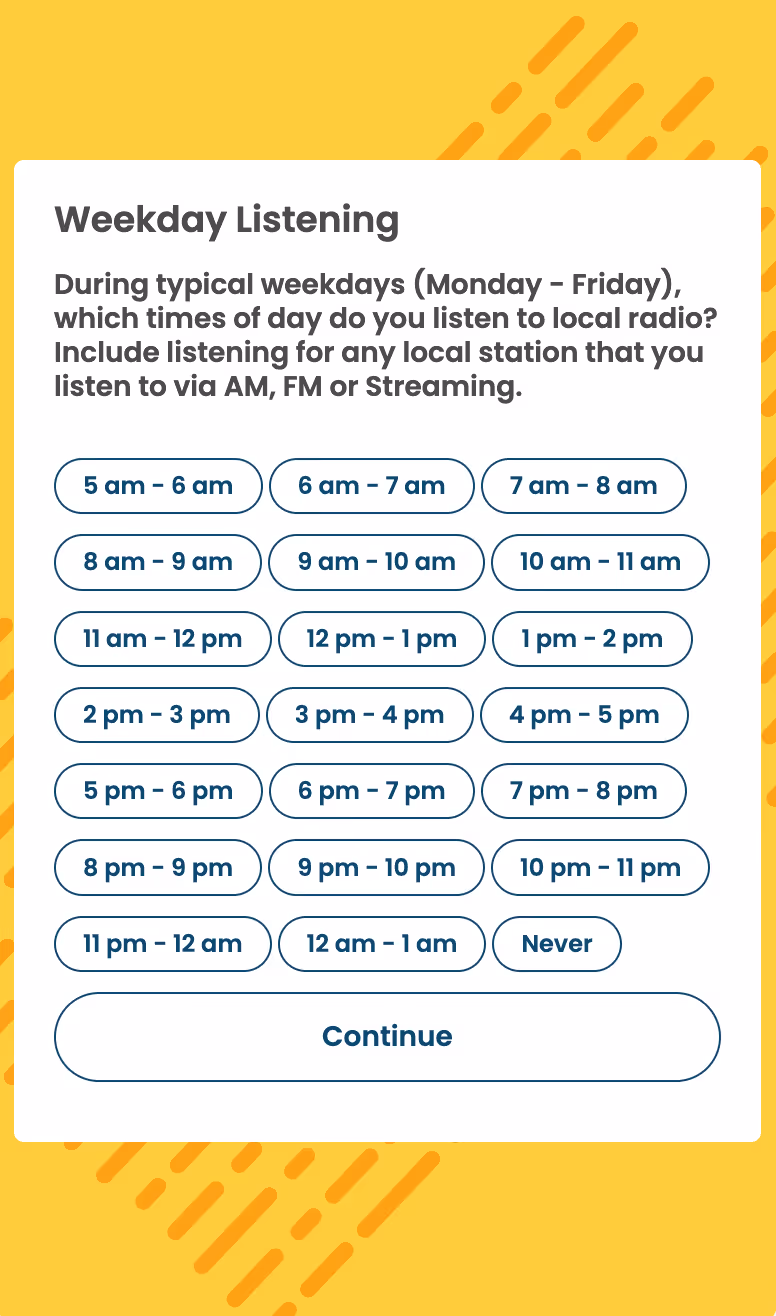
During typical weekdays (Monday - Friday), which times of day do you listen to local radio?
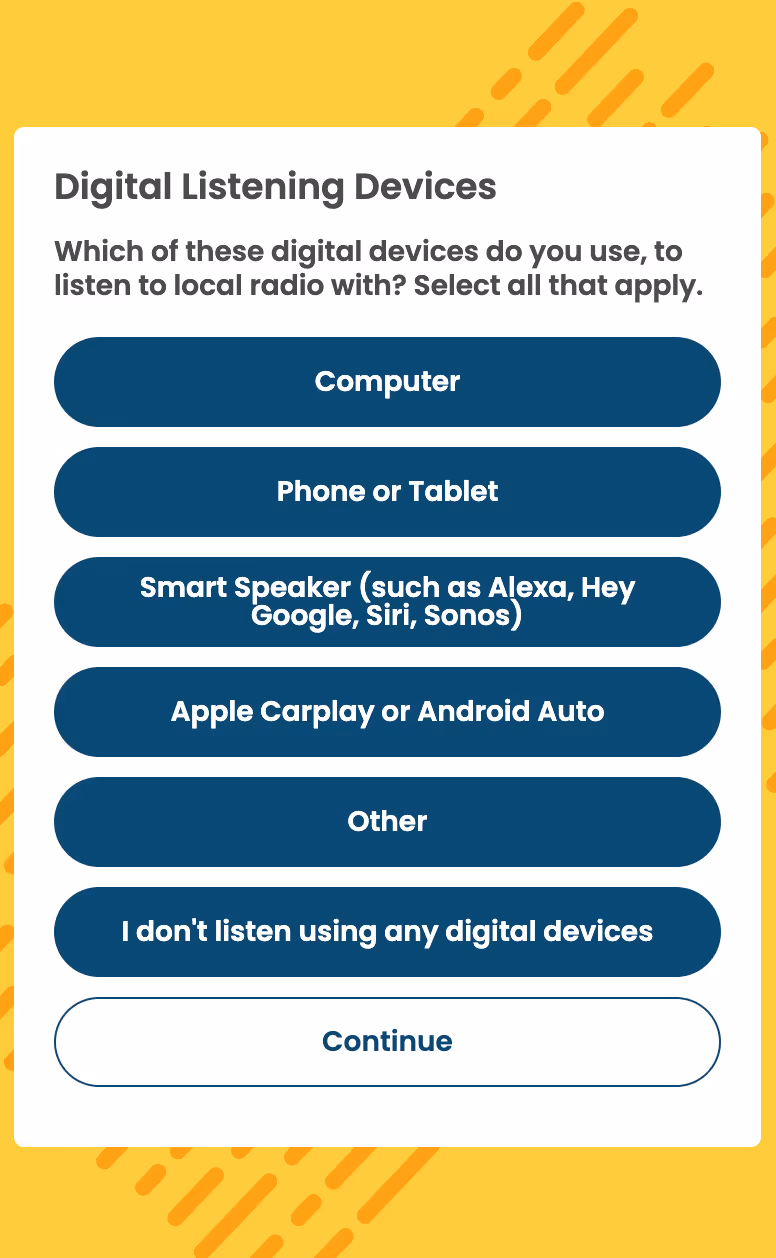
Which of these digital devices do you use, to listen to local radio with? (Computer, Phone or Tablet, Smart Speaker (such as Alexa, Hey Google, Siri, Sonos), Apple Carplay or Android Auto, Other, I don't listen using any digital devices)
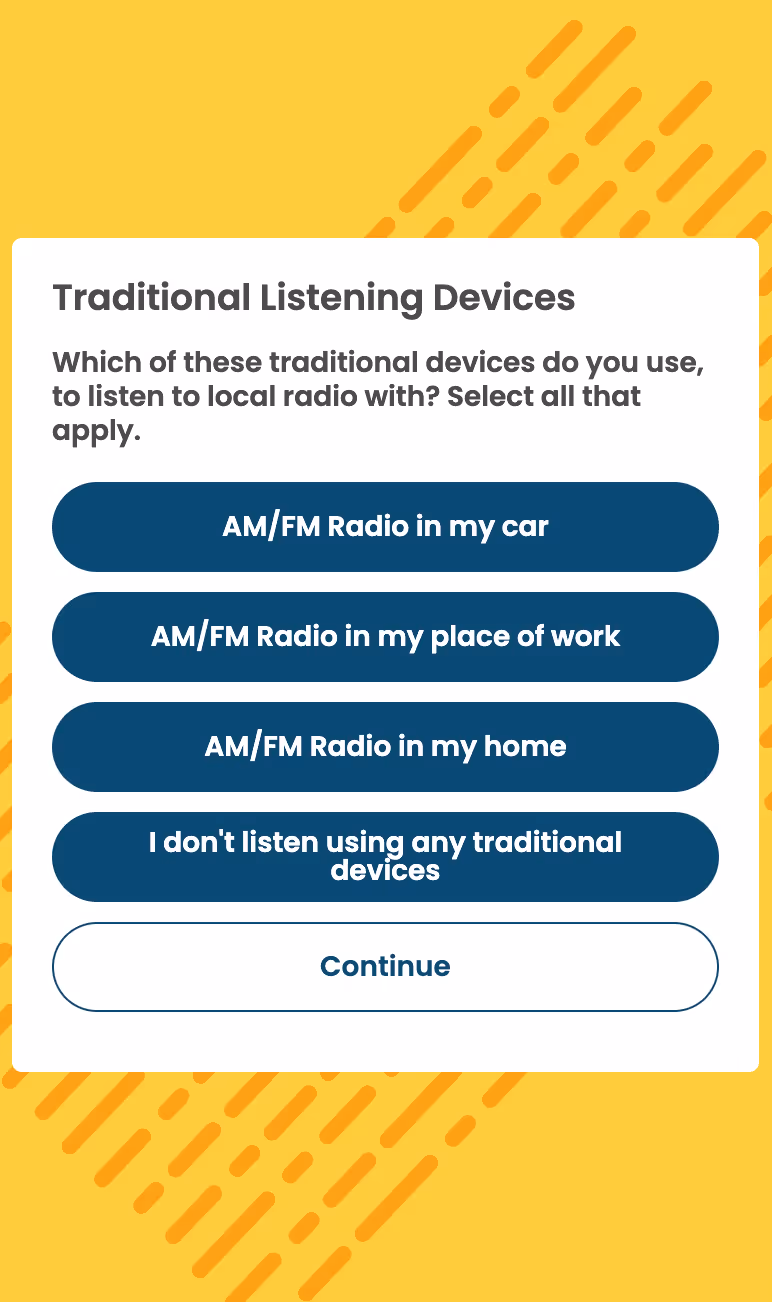
Which of these traditional devices do you use, to listen to local radio with? (AM/FM Radio in my car, AM/FM Radio in my place of work, AM/FM Radio in my home, I don't listen using any traditional devices)
For Bonus Entries, On the WEEKDAYS where you listen to local radio, how often do you listen on a Digital Device during this time? (Phones, Computers, Smart Speakers, CarPlay / Android Auto)

.avif)
The main KPIs were the survey results. Pattison Media’s focus wasn’t so much on gathering information, but rather finding out their most popular listening times and devices that were used. Even if a user gets their contact information card and doesn’t fill it out, he doesn’t mind as much because we still got an answer from them.
This campaign validated some of Pattison Media’s assumptions. One of the biggest pieces they wondered is if the small market, where there is shorter commutes, still performed the same way as the rest of their markets. They discovered that regardless of the size of the community the listening habits were the same.
39,568 total entries
42, 050 total responses to “Weekday Listening”
39, 622 total responses to “Digital Listening Devices”
29, 168 total responses to “Traditional Listening Devices”
21,167 listen in on Saturdays
19,183 listen in on Sundays
“We were looking to gain some behavioral insights from our audiences and ran a giveaway survey with advanced logic. We had expected to get around 10,000 entries but were able to get over 34,000 entries. The tool is very easy to create a user-friendly experience for the end user, especially on mobile.” - Andrew Snook, Director of Digital, Pattison Media
Pattison Media's journey from a 10,000-submission target to a remarkable 40,000 submissions showcases their commitment to understanding audience preferences. They managed 50 radio stations and sought insights into when and on which devices people tuned in. Their strategy, including conditional survey logic, a $5,000 incentive, and bonus entries, focused on uncovering popular listening times and devices among their audience.
This significant increase in submissions not only exceeded expectations but also provides Pattison Media with valuable insights to enhance their services. With their wide influence in Western Canada's media and entertainment sector, these findings will help them stay at the forefront of the industry by adapting to audience preferences.
%2520(1).png)